/RFID in Healthcare: An Information Management Perspective–Part 1")
What is RTLS?
To begin, let’s start with the definition of Real Time Location System (“RTLS”). Wikipedia says:
“RTLS are used to automatically identify and track the location of objects or people in real time, usually within a building or other contained area. Wireless RTLS tags are attached to objects or worn by people, and in most RTLS, fixed reference points receive wireless signals from tags to determine their location.”[1]
So in simple terms just what is a real-time location system? Think of RTLS as a GPS for the indoors—a system that displays the real-time locations of people and things where they are. The data shows the location on a floor plan of a building, or in a list.
Typically, an RTLS solution consists of a tag on mobile devices enabled with location technology. Each tag transmits its own unique ID in real time. Depending on the technology, the system locates the tags and the location of the tagged entities.
Location sensors—specialized fixed sensors that receive wireless signals from small tags—are attached to equipment or people. A simple RTLS/RFID system at a minimum has:
- Location engine software communicates with the tags and location sensors to determine the location of the tags.
- Middleware software resides among the pure RTLS technology components (the tags, the location sensors, and the communication software) and the business applications.
The RTLS application is the end-user application software that interacts with the RTLS middleware.[2]
The scope of possibilities for a healthcare RTLS project is virtually unlimited. RTLS can track a wide variety of assets including patients, visitors, and employees; equipment (biomedical, ancillary, IT, office); inventory controls, materials management; staff hygiene compliance; pharmaceuticals; blood products; lab specimens; medical records; and much more.
Numerous papers have been written about RTLS and its applications, especially in healthcare. This white paper focuses on the collection, integration, and dissemination of data in a healthcare setting. Many systems implement the hardware and software of solutions that perform these functions, but most systems lack the breadth or depth of insight that RTLS captures for the use and movement of the assets being tracked.
An Enterprise Information Management Framework shown in the illustration below breaks down overall information management into three (3) major domains and twelve (12) sub-domains, as follows:
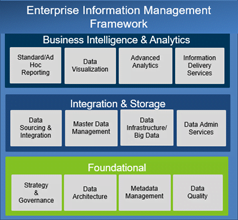
- Business Intelligence & Analytics (Information Utilization) focuses on how users access, use, and disseminate information for strategic and tactical decisions and performance and risk management.
- Integration & Storage (Enterprise Information Services) provides the mechanisms and processes by which data is sourced, aggregated, and assimilated across internal and external data sources.From an information services perspective, physical or virtual data must be integrated from disparate sources to obtain insights into the overall utilization of assets. The main data sources for this are RTLS and electronic health records (EHRs).
- Foundational (Data Strategy & Governance) concentrates on how an organization can most effectively define, share, manage, and utilize informational assets across the enterprise.
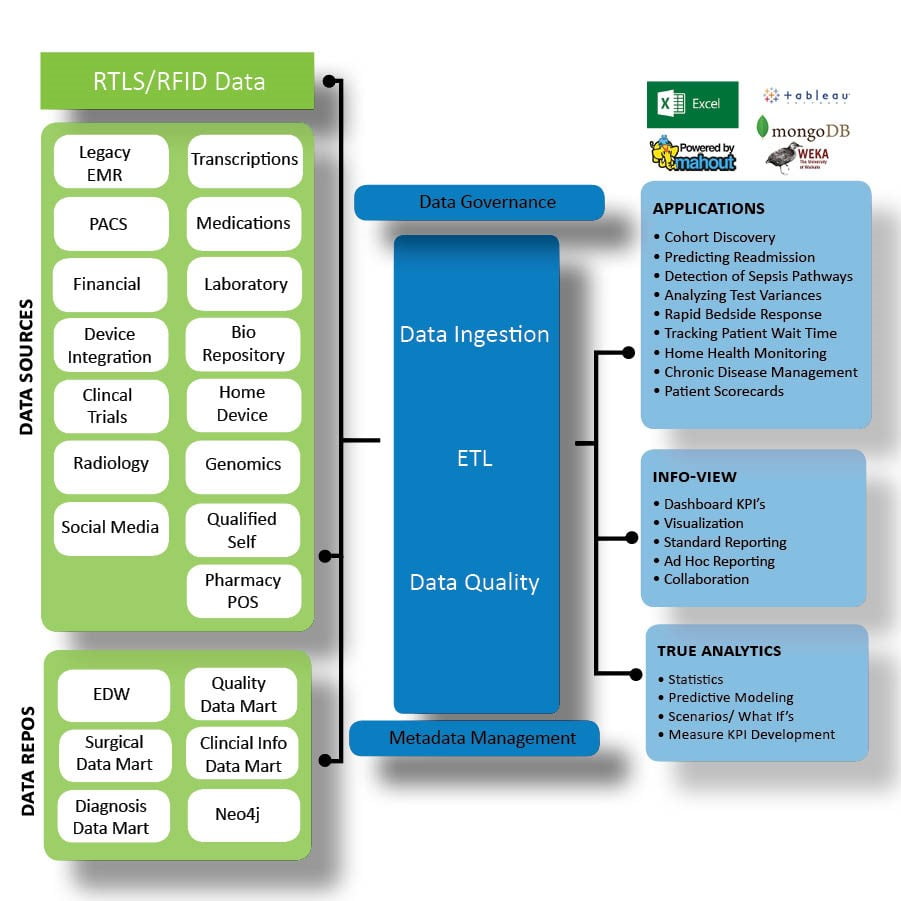
The RTLS tracks the changing location of data assets and healthcare staff and sends the information in real-time to a central data repository. Therefore, the intelligence reporting capabilities are endless. One of the key aspects of RTLS is the ability to perform not only real-time data analysis, but historical data analysis as well. As a primer, some use-cases appear below:
- Patient Care & Caregiver Analytics
- Facility Utilization Analytics
- Sensor Analytics
- Medical Equipment / Inventory Analytics
Patient Care & Caregiver Analytics
Hospitals in the US are experiencing financial and operational stress. Margins are thin and bed capacity is at a premium. Rather than increasing physical capacity to meet the growing demand from patients, hospitals can increase their capacity to provide services by improving their ability to move patients through the treatment system, a measure known as “throughput”. One of the ways this can be achieved is by managing and analyzing the available data assets. The benefits of analyzing and using data on patient flow are fairly well documented. Aggregating and measuring this data can lead to overall operational, financial, and performance improvements. Above all, data reporting and analysis can drive actions.
From an RTLS perspective, the event-driven solution tracks patients by recording “data” about their location, times, characteristics (e.g. risks, diagnoses, allergies) and status (e.g. waiting for x-ray, consultation, discharge). RTLS can strengthen patient flow in a variety of ways, but the most basic is the automation and documentation of activities— and the collection of metrics. These essential outputs result from monitoring data tags as they move across a facility.
For example, when a patient wearing a tag is moved from one department to another, an RTLS system can send an HL7 message to the electronic health record (EHR) that can reflect the duration, date and time the patient physically moved. In addition, information is captured about the staff who accompanied the patient during transport and interacted with the patient throughout the treatment. This data is time-stamped and can be used to conduct performance improvement analysis.[3]
Other detailed reports and analyses that can be generated from RTLS patient tracking data can include:
- Patient visit analysis
- Patients durations and time-stamped whereabouts
- Patient cycle time – allows managers to set patient flow milestone goals and identify patterns in that flow over set time periods
- Patients’ exam to vitals
- Patient time with doctors and clinicians
- Vitals to infusion
- Infusion time
- Patient wait times – keeping patients informed during wait times provides significant increases in customer satisfaction ratings
- Patient satisfaction reporting through the review of nurse and physician response time
- Patient status (ready to be seen, with physician, in X-ray, etc.)
- Patient Room status (available, assigned, in need of cleaning)
- Patients’ and caregivers’ next locations/steps
- Integrated with EMR data (e.g. Epic, Cerner) can generate first-hand patient data
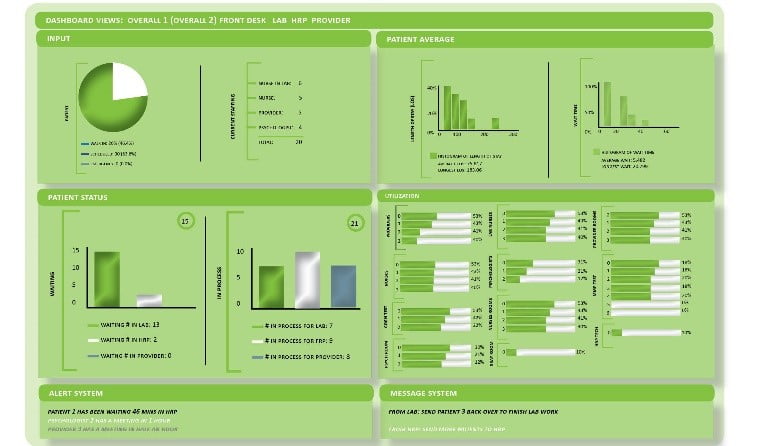
- Patient scheduling, lab & other data into one easy-to-read dashboard
- Historical analytics for continual process improvement
- Predictive analysis on patient in-flow and out-flow
- Predictions on patient wait-times
- Room utilization statistics for dynamic room assignments
- Compliance reviews to identify the frequency of caregiver rounding
In addition to patient care analytics, other data sources integrated with RTLS data can provide information on improving the productivity of nurses and caregivers. The streamlined process to collect and analyze data helps increase job satisfaction by reducing numerous mundane and repetitive tasks that staff encounter every day.
Facility Utilization Analytics
Another benefit of using RTLS asset distribution reporting is a more accurate and reliable way to identify facility utilization by department, floor and zones to ensure the availability and optimization of equipment in the facility. Some examples are:
- Utilization by buildings
- Utilization by floors
- Utilization of rooms – room occupancy reporting gives managers insight into how rooms are being utilized with metrics like patient in-room and staff in-room with patient
- Facility capacity planning and load balancing
Sensor Analytics
Sensor data is gathered continuously. The analytics “learn” asset activity patterns, and can quickly alert caregivers of departures from the norm (a drop in blood pressure etc.), in the hopes of heading off urgent situations. Sensors can be used for several reasons some of them being:
- Temperature reporting to ensure compliance
- Events Summary
- Humidity History
- Patient safety through exception reports of non-compliant staff and hand hygiene protocol.
Medical Equipment/Inventory Analytics
Managing thousands of costly, mobile equipment is challenging and labor-intensive. A significant portion of asset inventories are lost, stolen or misplaced, impacting productivity every day. Lowering inventory expenses, shortening equipment times, preventing theft and automating maintenance is possible with real-time visibility into the location and status of equipment (i.e. sterilized/unsterile, broken/fixed, in use/available). Several reports/dashboards can be generated from tagged equipment to get information about:
- Medical Equipment Inventories
- Equipment locations dashboard – these reports/dashboards can
- potentially reduce Staff time loss in equipment location attempts
- Maintenance personnel searching for equipment to service
- removing nonfunctioning equipment from regular use
- Trend analysis of equipment used within the care facility
- Equipment/Asset usage by location
- Equipment utilization optimization
- Equipment loss analytics
- Track predict and reduce waste, fraud and abuse
- Statistical reports identifying frequency of use of specific devices to help eliminate underutilized equipment
- Shorten equipment preparation time of medication
- Tracking sterilization patterns and impact to patient safety
Conclusion
In the healthcare industry, facility managers and caregivers often find themselves with limited resources, lack of timely data, and unexpected crisis that they have to respond to. While the use of an RTLS is an improvement, it isn’t enough to dramatically improve healthcare to the level it needs, or to provide valuable real time data to the administrators who use the system to track, treat, and report both patient progress and their current status. However, Information obtained from the various healthcare data sources integrated with RTLS data can provide a wealth of insights and the opportunity for cost savings and/or cost avoidance. This integrated data can be used to implement simulations and models to do “what-if” analysis and create improved data visualizations. The advanced analytics and visualizations can support tactical real-time operational decisions as well as strategic trend analysis and predictions.
[1] Wikipedia
[2] Malik A: RTLS For Dummies
[3] Transforming Process Improvement through RTLS Data, Sarah Kadish, Dana-Farber Presentation